
www.simplify-data.de
Power BI: A Tool for Data Visualization and Decision Making
Power BI: A Tool for Data Visualization and Decision-Making
What Is Power BI?
Power BI is a suite of business analytics tools developed by Microsoft. It enables users to collect, transform, and visualize data from various sources. The goal is to create interactive reports and dashboards that help decision-makers make informed decisions. Power BI is accessible to both technical and non-technical users, making it a popular choice for businesses of all sizes.
How Does Power BI Work?
Power BI operates in three main steps:
- Data Import: Users can import data from a variety of sources, including Excel spreadsheets, databases, cloud services such as Azure, and more.
- Data modeling: With Power BI, users can transform and model data to prepare it for analysis. This includes cleaning data, creating calculations, and defining relationships between data sets.
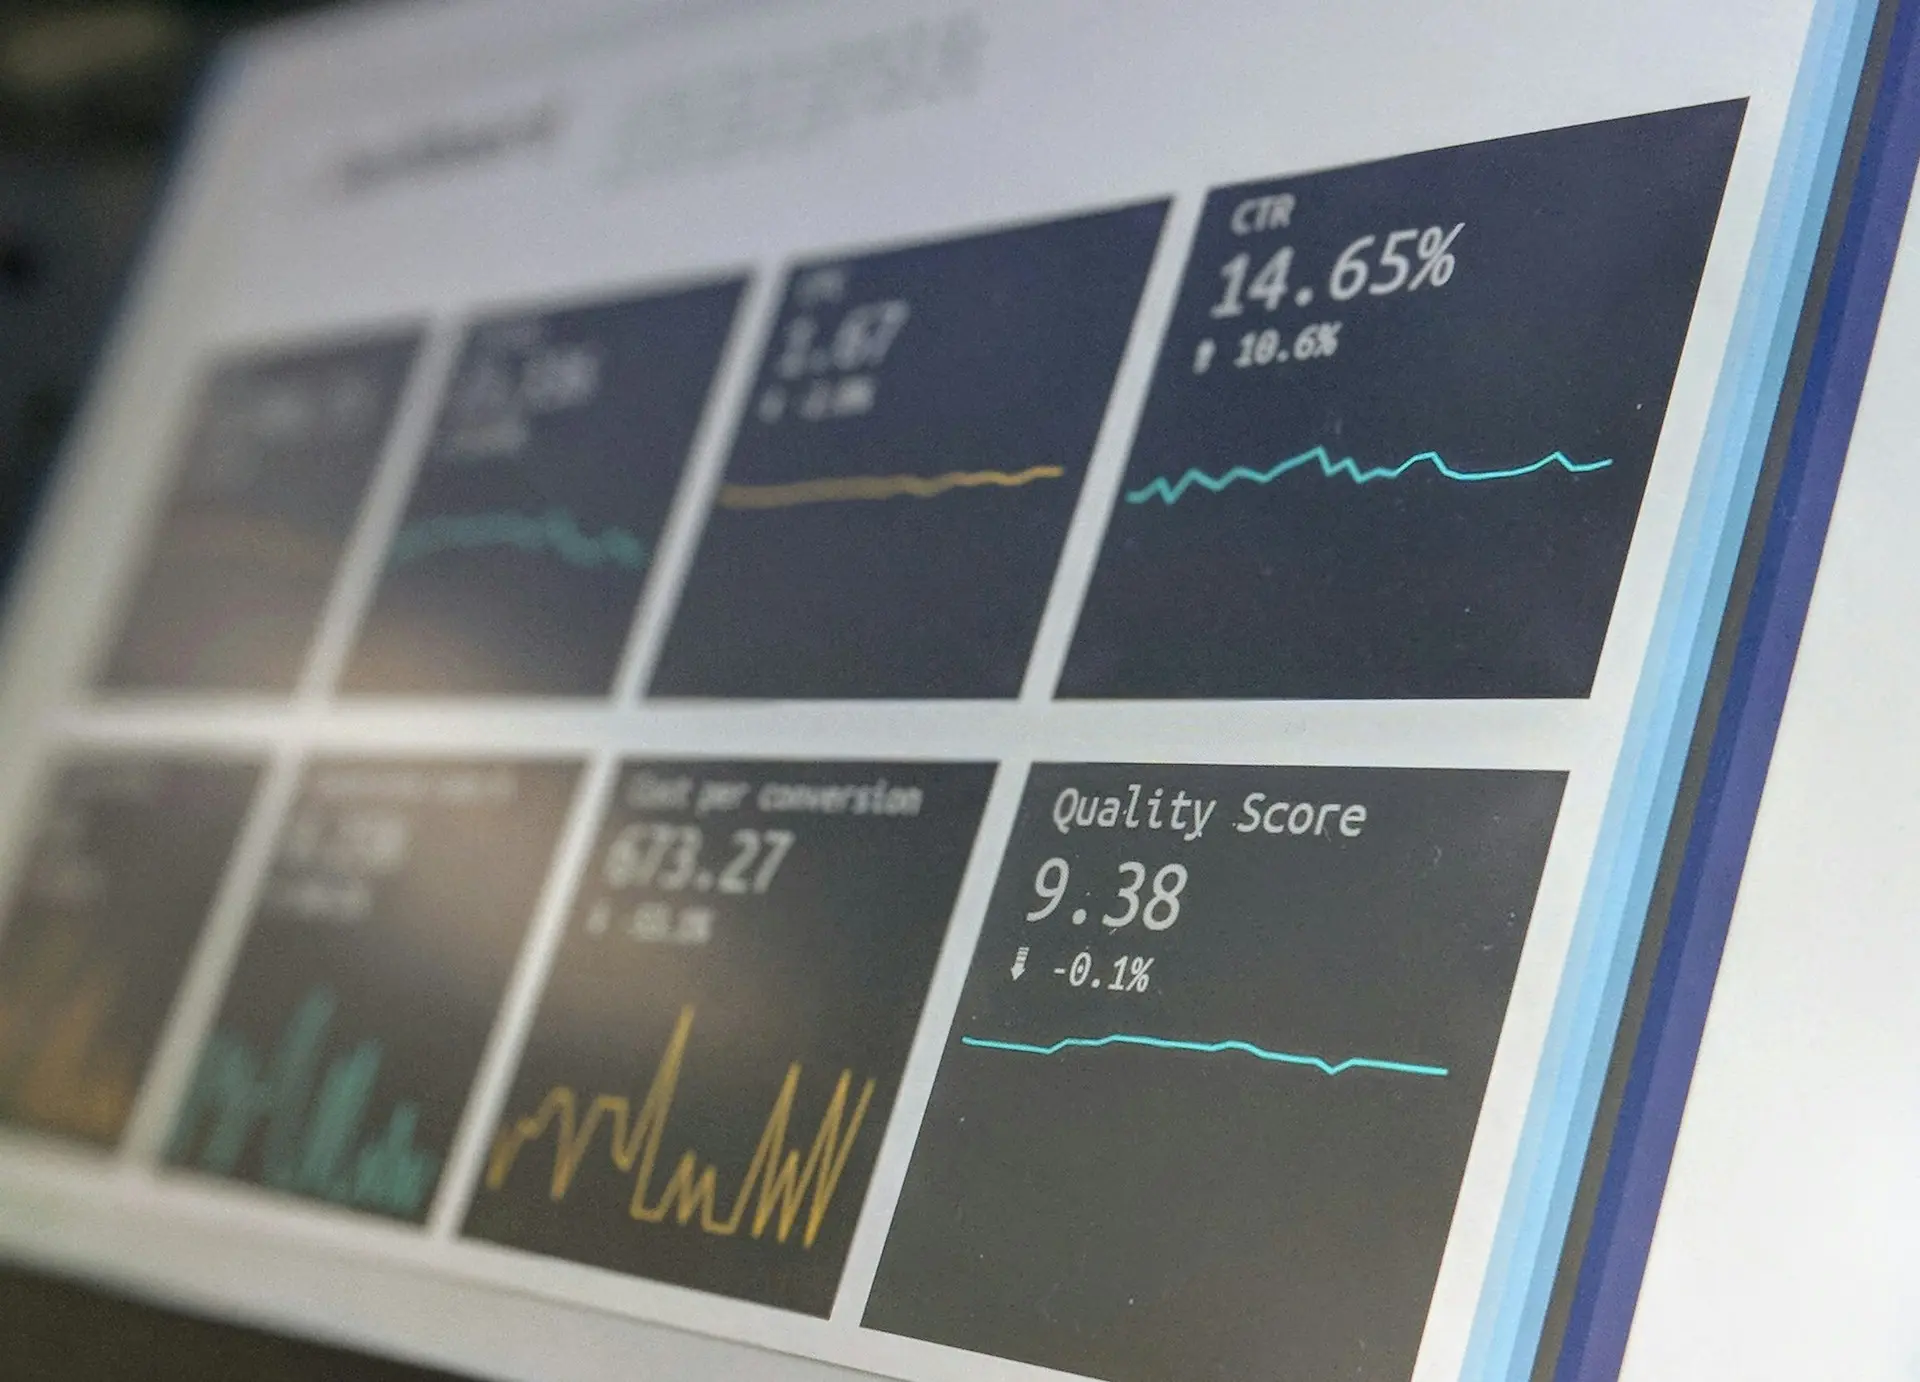
- Data visualization: Users can create interactive reports and dashboards that update in real time. These visualizations help identify patterns and trends in the data.
Power BI Use Cases
Sales Analysis
A company can use Power BI to analyze sales data and identify patterns in customer behavior. By creating a dashboard that shows sales figures by region, product line, and time frame, sales managers can quickly see which products are performing well and where improvements are needed.
Financial Reporting
Finance teams can use Power BI to transform complex financial data into understandable reports. An interactive dashboard can help keep track of revenue, expenses, and profits and monitor a company’s financial health in real time.
Human Resources
HR departments can use Power BI to analyze employee data. This includes monitoring hiring and turnover rates, analyzing employee satisfaction, and planning training initiatives.
Tips for Using Power BI Effectively
- Know Your Data Sources: Make sure you know where your data comes from and how up-to-date it is.
- Use DAX Functions: Data Analysis Expressions (DAX) are powerful formulas that can help you perform complex calculations in your reports.
- Create custom visualizations: Take advantage of the ability to create your own visualizations to meet your company’s specific needs.
- Automate reports: Set up automatic updates for your reports to ensure you’re always working with the latest data.
Real-World Example: Insights into the Retail Industry
A retail company used Power BI to optimize inventory levels across its stores. By analyzing sales data and inventory levels in real time, the company was able to streamline product reordering while reducing inventory costs. An interactive dashboard enabled managers to respond quickly to changes in sales behavior and make informed decisions.
Conclusion
Power BI is an indispensable tool for companies that want to effectively use their data to make better business decisions. Whether you work in sales, finance, or human resources, Power BI offers you the flexibility and tools you need to turn your data into valuable insights.
If you’d like to learn more about how Power BI can help your business, or if you need assistance with implementation, don’t hesitate to contact Simplify Data GmbH. We’re here to help you get the most out of your data. Visit us on our Contact Page.